Participant Satisfaction
Profiles of People Involved in the Project
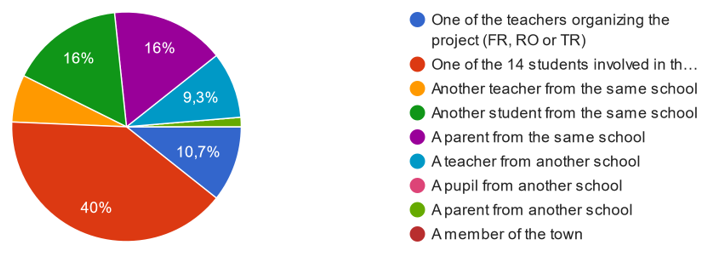
The pie chart shows the different groups of individuals who were involved in the project and their respective percentages. Each segment represents a distinct profile, including students, teachers, parents, and community members. The colors and percentages on the chart indicate the distribution of these profiles.

The largest group, making up 40% of the participants, consists of the students directly involved in the project. This indicates that students were the central focus of the project and played a major role in its implementation.
Parents from the Same School (16%) and Members of the Town (16%) also made up notable portions of the participants. This shows that both local parents and community members were actively involved or engaged in the project, highlighting its broader impact beyond just the students and school staff.
Teachers organizing the project (9.3%) from the participating countries (France, Romania, and Turkey) were a smaller but crucial group, responsible for guiding and managing the project.Additionally, teachers from the same school (10.7%) and teachers from other schools (5.3%) were involved, demonstrating a collaborative effort among educators, both from within the participating schools and external institutions.
Other students from the same school (10.7%) and pupils from other schools (5.3%) represent smaller portions of the participants, indicating some involvement of peers not directly part of the project.Parents from another school (5.3%) also contributed, though their involvement was relatively limited compared to parents from the same school.
The project had a diverse set of participants, with the largest group being the students directly involved (40%). Significant involvement from parents and community members (16% each) shows the project’s wide reach and community engagement. Teachers played an important role in organizing and managing the project, alongside other students and external educational professionals. This distribution indicates that the project fostered a collaborative environment, engaging multiple stakeholders from both within the school and the broader community.
Satisfaction Percentage
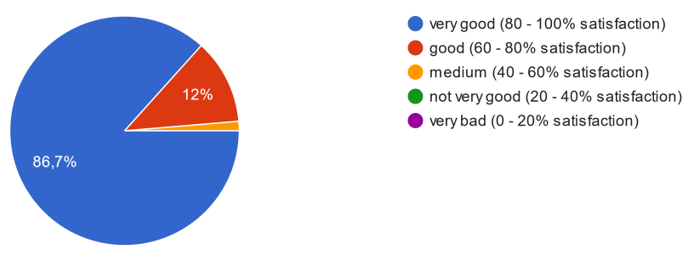
This chart displays the satisfaction levels of participants involved in the project. The different segments show varying degrees of satisfaction, categorized from « Very Good » to « Very Bad. » The majority of respondents fall into the highest satisfaction category, with smaller portions in lower satisfaction categories.

86.7% of the participants reported a very good satisfaction level (80-100% satisfaction).This overwhelming majority indicates that most participants had an extremely positive experience with the project. The high satisfaction rate suggests that the project met or exceeded their expectations in terms of objectives, engagement, and outcomes.
12% of the respondents rated their satisfaction as good (60-80% satisfaction).While not as high as the “very good” category, this still reflects a largely positive experience for these participants, suggesting that they were satisfied with most aspects of the project, though there may have been minor areas for improvement.
A small 1.3% of respondents reported medium satisfaction (40-60% satisfaction).This indicates a neutral or average experience for a few participants, suggesting that while they did not have a negative experience, the project may not have fully met their expectations or needs.
The pie chart shows a clear trend of very high satisfaction among participants, with 86.7% rating their experience as « very good. » Combined with the 12% rating it as « good, » the project achieved overwhelmingly positive feedback (98,7%).
Conclusion on the Positive Impact of the Project
The results from the satisfaction survey and the post-test analysis clearly demonstrate the very positive impact of the project on its participants. With 86.7% of respondents rating their satisfaction as « very good » and another 12% rating it as « good, » it is evident that the project not only met but exceeded the expectations of the majority of participants. The improvements observed in the post-test scores further confirm that the project significantly enhanced the participants’ knowledge and skills in key areas such as nutrition, mental well-being, and sports.
Additionally, the involvement of a diverse group of individuals – students, teachers, parents, and community members – highlights the project’s ability to foster a collaborative and inclusive environment. The overwhelmingly positive feedback and measurable progress in learning outcomes underscore the effectiveness of the project in achieving its objectives. Overall, this initiative has made a substantial contribution to improving the well-being and understanding of healthy lifestyles for those involved, leaving a lasting impact on the participants.