Competency Assessment
Pré-test
At the beginning of the project, we administered a pre-test to assess the students’ initial knowledge in the three key areas of the project: nutrition, mental well-being, and sports. This pre-test was designed using the 4 to 6 questions we developed for each of the competencies identified in the initial report. The goal was to get a baseline understanding of the students’ awareness, habits, and understanding of these topics before any interventions or educational activities were implemented. This provided us with valuable insights into their starting points, allowing us to tailor the program more effectively to their needs and challenges in these areas.
Post-test
Nearly two years later, at the end of the project, we administered the same test again as a post-test to evaluate whether the students had made progress. By comparing the results of the pre-test and the post-test, we were able to measure the impact of the project and determine whether the students had improved their knowledge and practices in nutrition, mental and physical well-being, and sports. This comparison allowed us to clearly see the areas where the students had developed stronger skills and understanding, and also identify any remaining gaps that needed further attention.
Comparison and report
Post-test variation for the studied skills
The values in the chart represent the average scores of all the competencies studied within each subject. For each topic, the results reflect the mean performance of the students across the various competencies assessed in that particular area.

The chart compares the pre-test and post-test results in three areas: Nutrition, Mental Well-Being, and Sport. The pre-test results are represented by the yellow bars, while the post-test results are shown in green.
There is a significant improvement in the students’ knowledge or competency in nutrition. The post-test results show a noticeable increase, indicating that the participants gained substantial knowledge on this topic over the course of the project.
The improvement in the area of mental well-being is also considerable. The high initial score suggests that students already had a good understanding of mental well-being at the start, but the project further strengthened their knowledge, as evidenced by the increase in post-test results.
Like the mental well-being category, the results for sports show a positive trend. Students had a relatively strong starting point, and the post-test scores indicate further improvement, possibly in understanding the importance of sports or increasing their engagement in physical activities.
Across all three topics—Nutrition, Mental Well-Being, and Sport—the post-test scores are higher than the pre-test scores. This suggests that the project had a positive impact on the students’ knowledge and understanding in each of these areas. The most significant improvement was seen in Nutrition, while Mental Well-Being and Sport showed more modest, yet still meaningful, gains.
Post-test variation for each student
The graph represents the variation in scores for each student after taking the post-test, comparing their results with the pre-test. Each bar corresponds to a student, showing the change in their performance. Green bars indicate positive improvement, while the single red bar reflects a negative result, meaning that the student’s score decreased in the post-test.
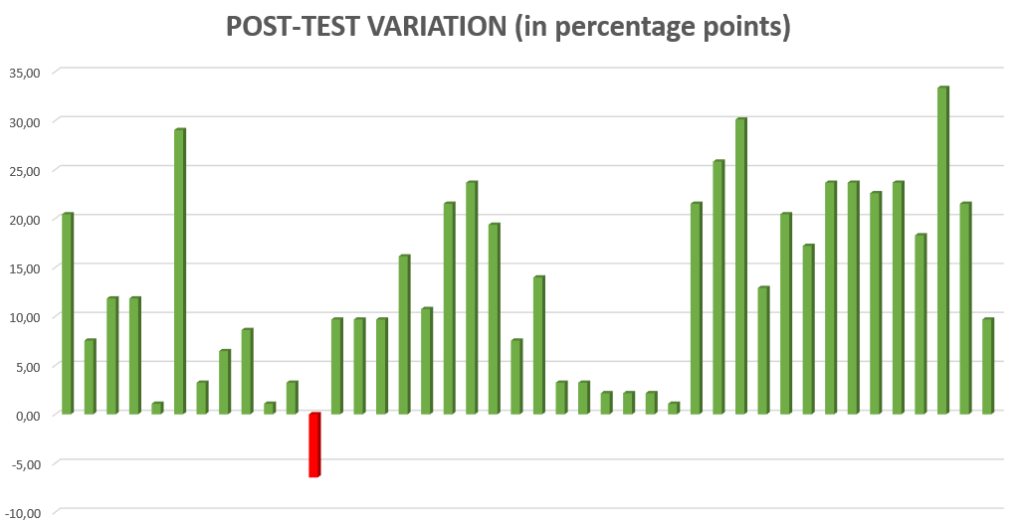
Most students show positive variation, meaning their scores improved after the project.The majority of students have improvements ranging between 5% and 25%, with several outliers achieving over 30% improvement.This indicates that the project had a substantial impact on the majority of participants, with many students significantly increasing their understanding or skills across the three topics (Nutrition, Mental Well-Being, and Sport).
There is one notable negative variation (red bar), where a student’s post-test score was approximately 5% lower than their pre-test score.This suggests that for this particular student, there may have been challenges in retaining or applying the knowledge gained during the project. However, this is an exception, as most students experienced positive progress.
Overall, the chart shows that most students experienced a positive change in their performance on the post-test, with a wide range of improvements. The project appears to have been effective in helping students improve their knowledge or skills in Nutrition, Mental Well-Being, and Sport. However, the variation in performance gains suggests that some students benefited more than others, and one student had a slight decline in performance. This could indicate areas for further investigation, such as personalized support or additional focus on certain topics for specific students.